Visual node graph with ImGui
I wanted my first post on this blog to be about the node graph system that I created for my personal graphics engine named “RogueEngine”. I may talk about the engine itself in another post but for now I’d like to focus on its UI.
As a teaser, here’s a screenshot of the tool running our Revision 2023 demo:
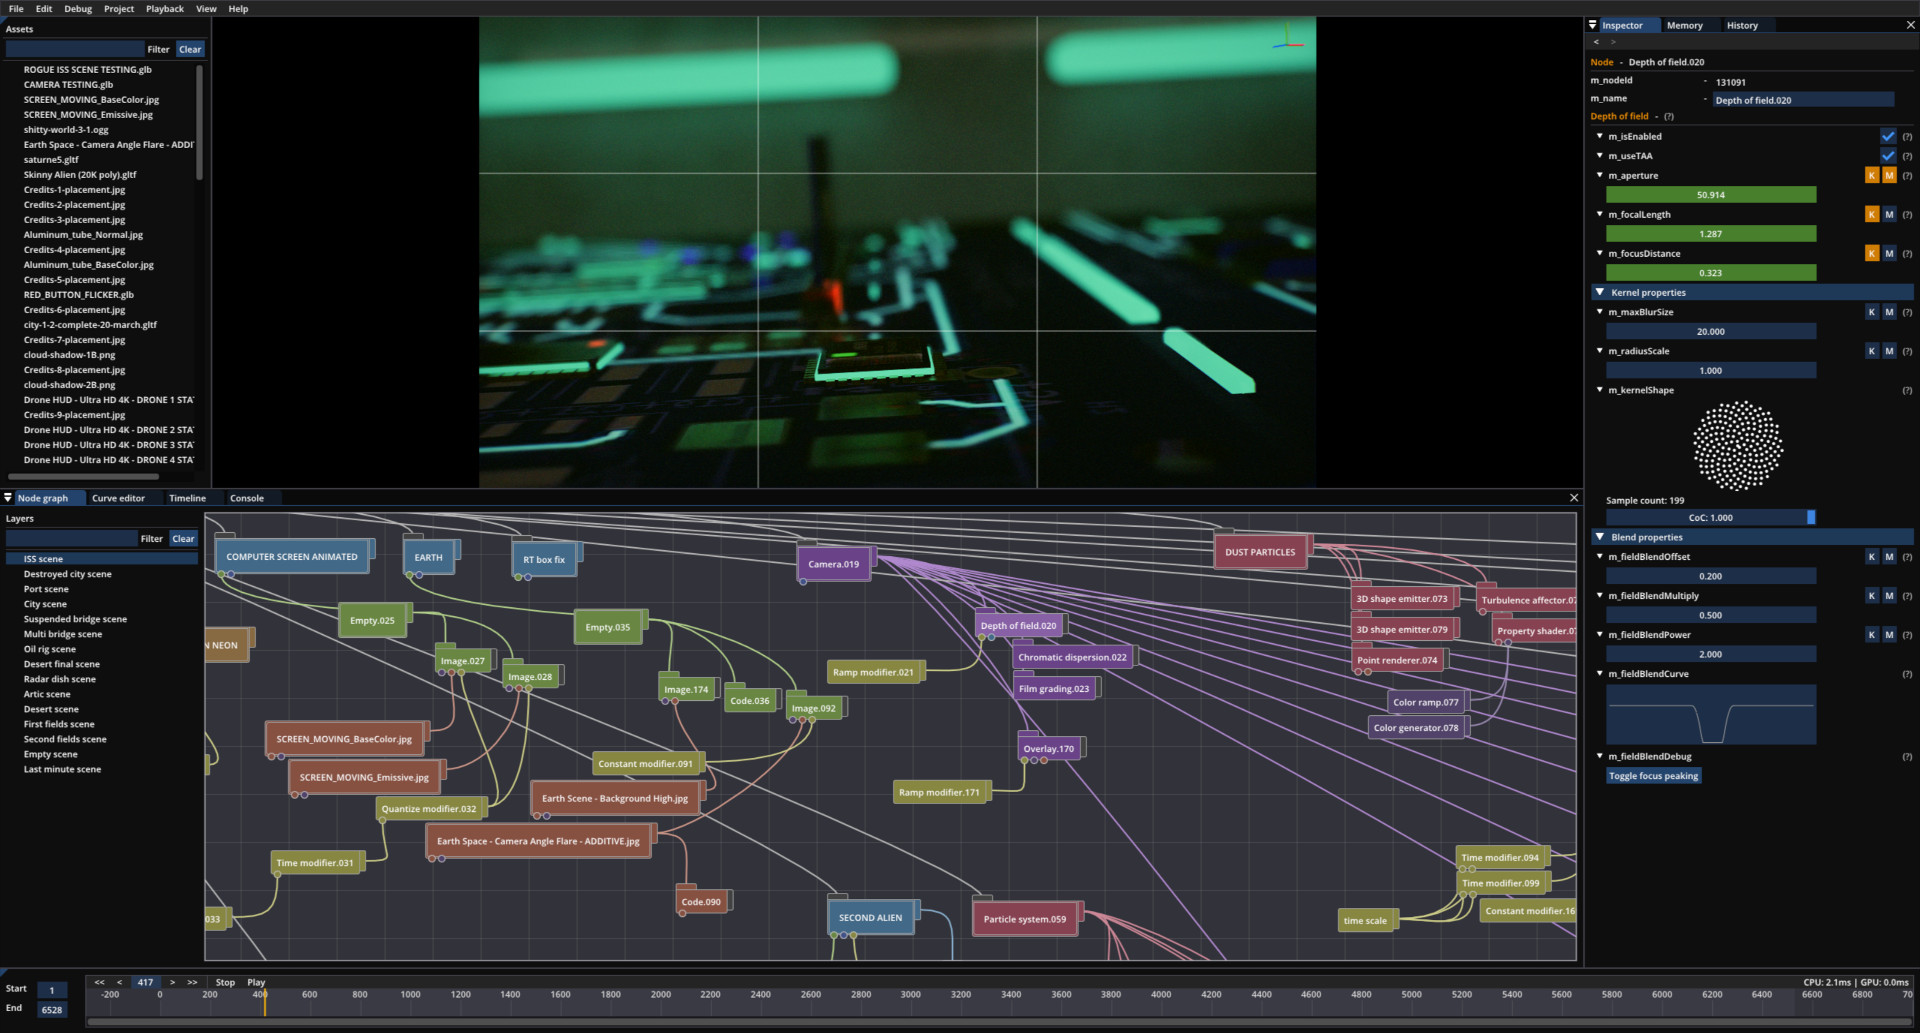
Intro sequence from Reality Check.
A bit of background
I started thinking about this project back in 2019 with the aim of releasing some PC demo productions. I had heard of the demoscene for the first time a few years earlier through some coworkers at Sony and it gradually grew on me to the point that I too wanted to participate. I really wanted to be able to team up with artists and designers for making these rather than, say, other programmers or trying to complete a production on my own. This seemed like a better way to reach a higher visual bar as well as being more entertaining overall. 🙂
This translated in my mind to having an interface that anyone could use for interacting with and tweaking the content, although in retrospect, such a system comes in extremely handy for programmers too and I find myself increasingly using it for many purposes, such as research and experimentation. Regardless, I started looking into interfaces for visual content creation, which were at the time both quite fascinating and mysterious to me having little to no experience with such systems.
I was initially not particularly fond of node graphs however, for mainly two reasons:
- Many of these systems seemed to be what I’d call “coding with nodes”; while it may be more visual, it isn’t fundamentally any simpler.
- It can get real messy real fast.
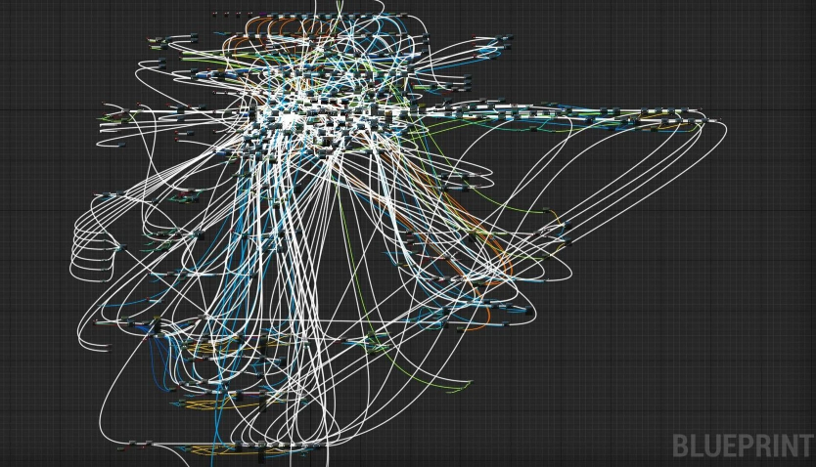
Courtesy of blueprints from hell.
Node systems were still appealing to me however for different reasons;
they felt more intuitive and less intimidating than other solutions with more “traditional” UI and they tend to look really nice on screenshots.
Then maybe it’ll be easier for me to convince other people to get on board? 🙂
So, I started thinking about a node system that would not be “coding with nodes”.
Node system
Having little to no experience with node-based systems, I went ahead and looked at other software for inspiration. Big sources of inspiration for me would be software such as Blender, Notch, and Godot. In particular, I was wondering how to create a system that’d be both easy to use and expressive enough to allow the creation of interesting and emergent effects rather than simply ticking available engine features on or off…
Towards the end of 2019, something somewhat clicked in my mind; I’d design the system to have only two types of nodes (okay, three) and they’d work like this:
- The root node from which the graph traversal would start at runtime.
- The data node representing a piece of data of a given type.
- The component node that can be attached to a data node to modify it.
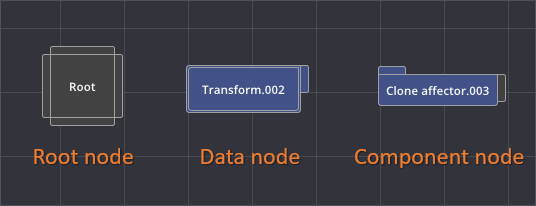
The different node types.
This seemingly simple setup seemed to open a lot of possibilities. 🙂
I could have some “geometry data node” being nothing more than an index and a vertex buffer (plus some bounding box and probably other things…) while a “component node” connected to it would act as some kind of vertex shader that could be used for displacement purposes.
Similarly, a “shading data node” could represent a standard material while a “component node” would be some piece of code to be injected into the fragment shader for various per-pixel procedural shading effects.
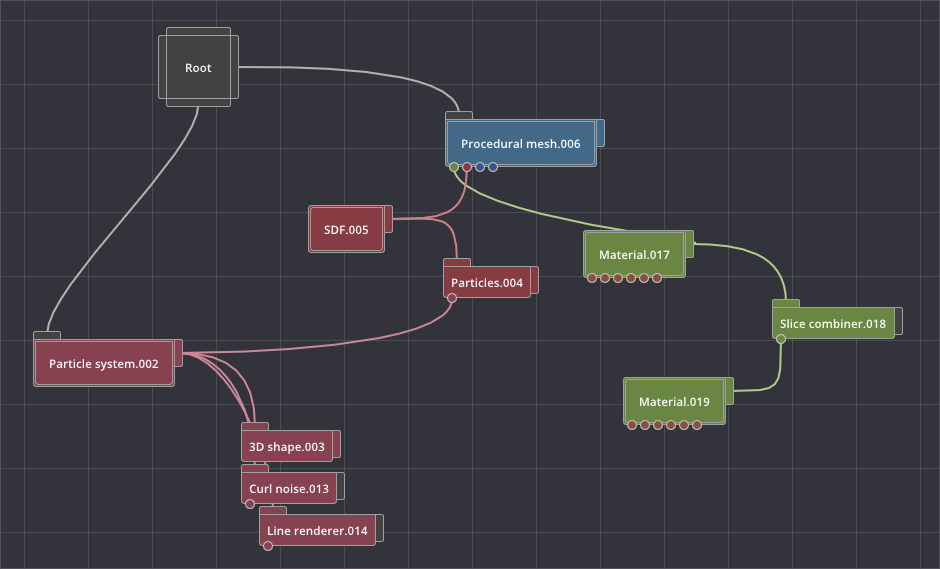
This felt like a good solution; I could instantly see how most features could map to this setup and it most definitely wasn’t a visual programming system… As an illustration, here’s a collection of the different node categories available in the engine at the time of writing:
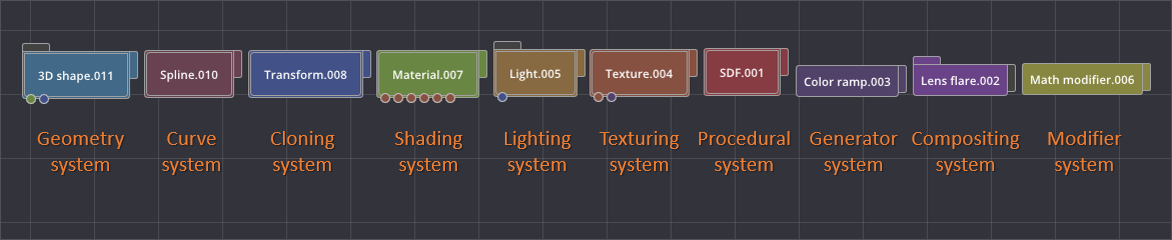
The available node categories in RogueEngine.
The great thing about this approach is that the dependent nodes do not need to know how the data from the data node came to be (in the case of the geometry category, it could be a procedurally-generated mesh, geometry loaded through some glTF file, or even metaballs generated from the particle system), the format of the data node being fixed (in this case, an index and a vertex buffer…), we always know how to operate on it. 🙂
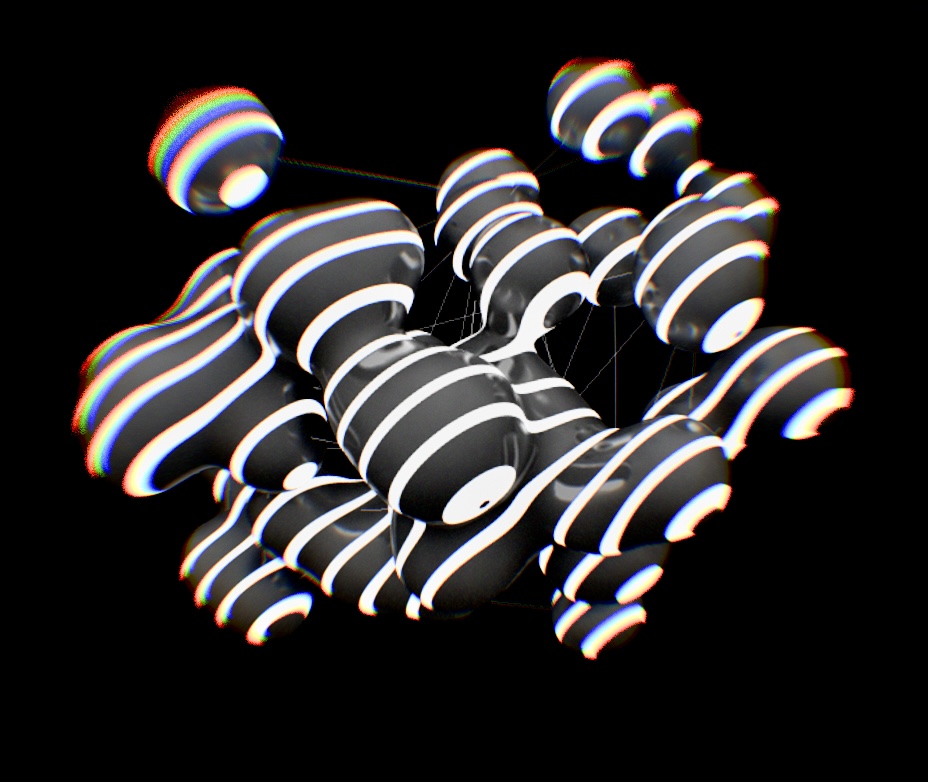
Metaballs created using the nodes, a classic of the demoscene.
Data model vs. GUI code
Now that I knew how my node system would operate, I had to find how to implement it. My plan was to use Dear ImGui for the UI because it’s a joy to use and, I must admit, I had little intention of investigating other GUI solutions. ImGui is actually a great fit I found to crafting such a creative UI system.
The main insight to take away in my opinion is the need to separate the data (what I’d call the data model) from the UI logic (often referred to as the view). Having such a separation naturally implies creating an interface for iterating the data inside your “project” that can then be used both by the runtime, when playing back the demo content, and the ImGui code, when running the editor.
Our first step should therefore be to define that data model, so here goes:
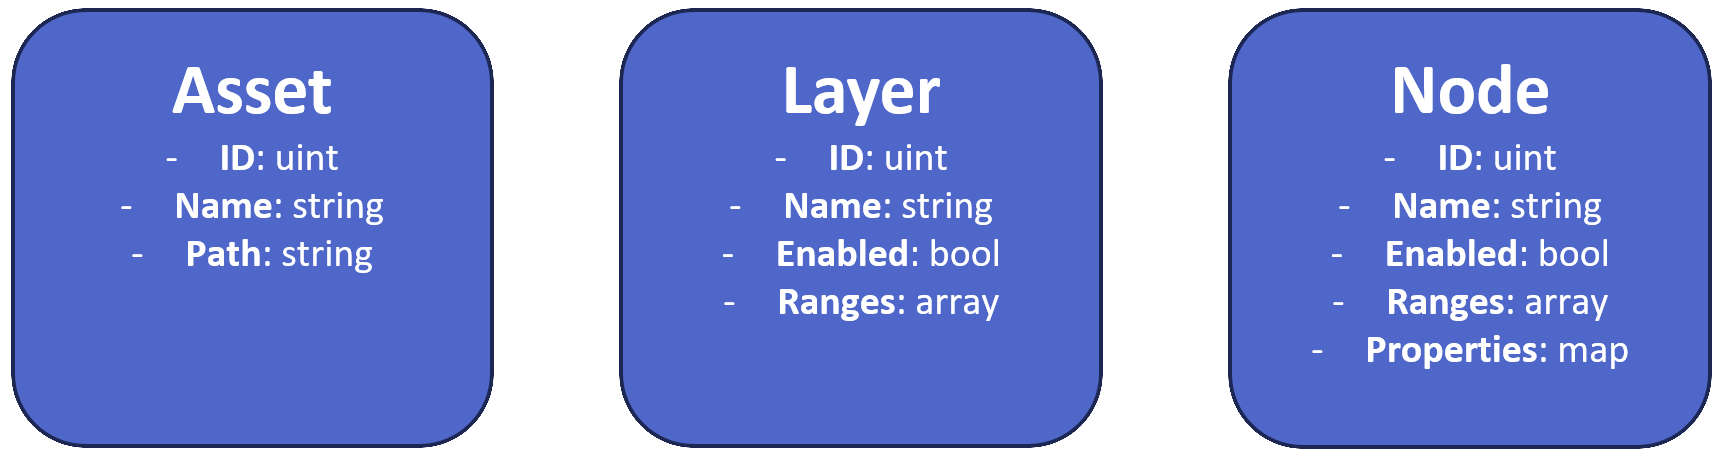
Data model for RogueEngine’s runtime.
There are essentially only three types of resources that a user can interact with through the interface and manipulate within a project (along with a few more as detailed below…):
- Assets: A list of all your imported 3D models, textures, music files, etc.
- Layers: These allow to group nodes, mostly to facilitate multi-scene projects.
- Nodes: Nodes belong to their parent layer and can be executed by the runtime.
Furthermore, Ranges represent the series of time segments for when a particular resource is active on the timeline, while Properties represent, as the name suggests, the properties of a given node, such as values and colors, links to assets and/or other nodes, etc.
Having such a clearly defined data model makes it easy to serialize and deserialize the content of a project (for saving and loading purposes respectively) as we can rely on a well identified distinction between what should be persisted vs. what’s engine specific.
The timeline panel allows the edition of ranges, i.e., when is a node or layer active or not.
Finally, such a setup makes it rather simple to implement dreaded (but oh so useful!) features such as undo/redo.
I picked the same approach as @voxagonlabs and went ahead with serializing the whole project on every change to the data model.
This may sound rather inefficient (and I’m sure it won’t hold up past certain project sizes…) but there isn’t really all that much data you typically have to serialize when saving a project.
So, it’s definitely good enough for now and makes undo/redo indeed trivial to manage. 🙂
Animating the scene
Next stop on the road was to get things moving.
My plan here was to allow keyframing any property that’s either a float or a vector of floats (e.g., vec2, vec3, vec4).
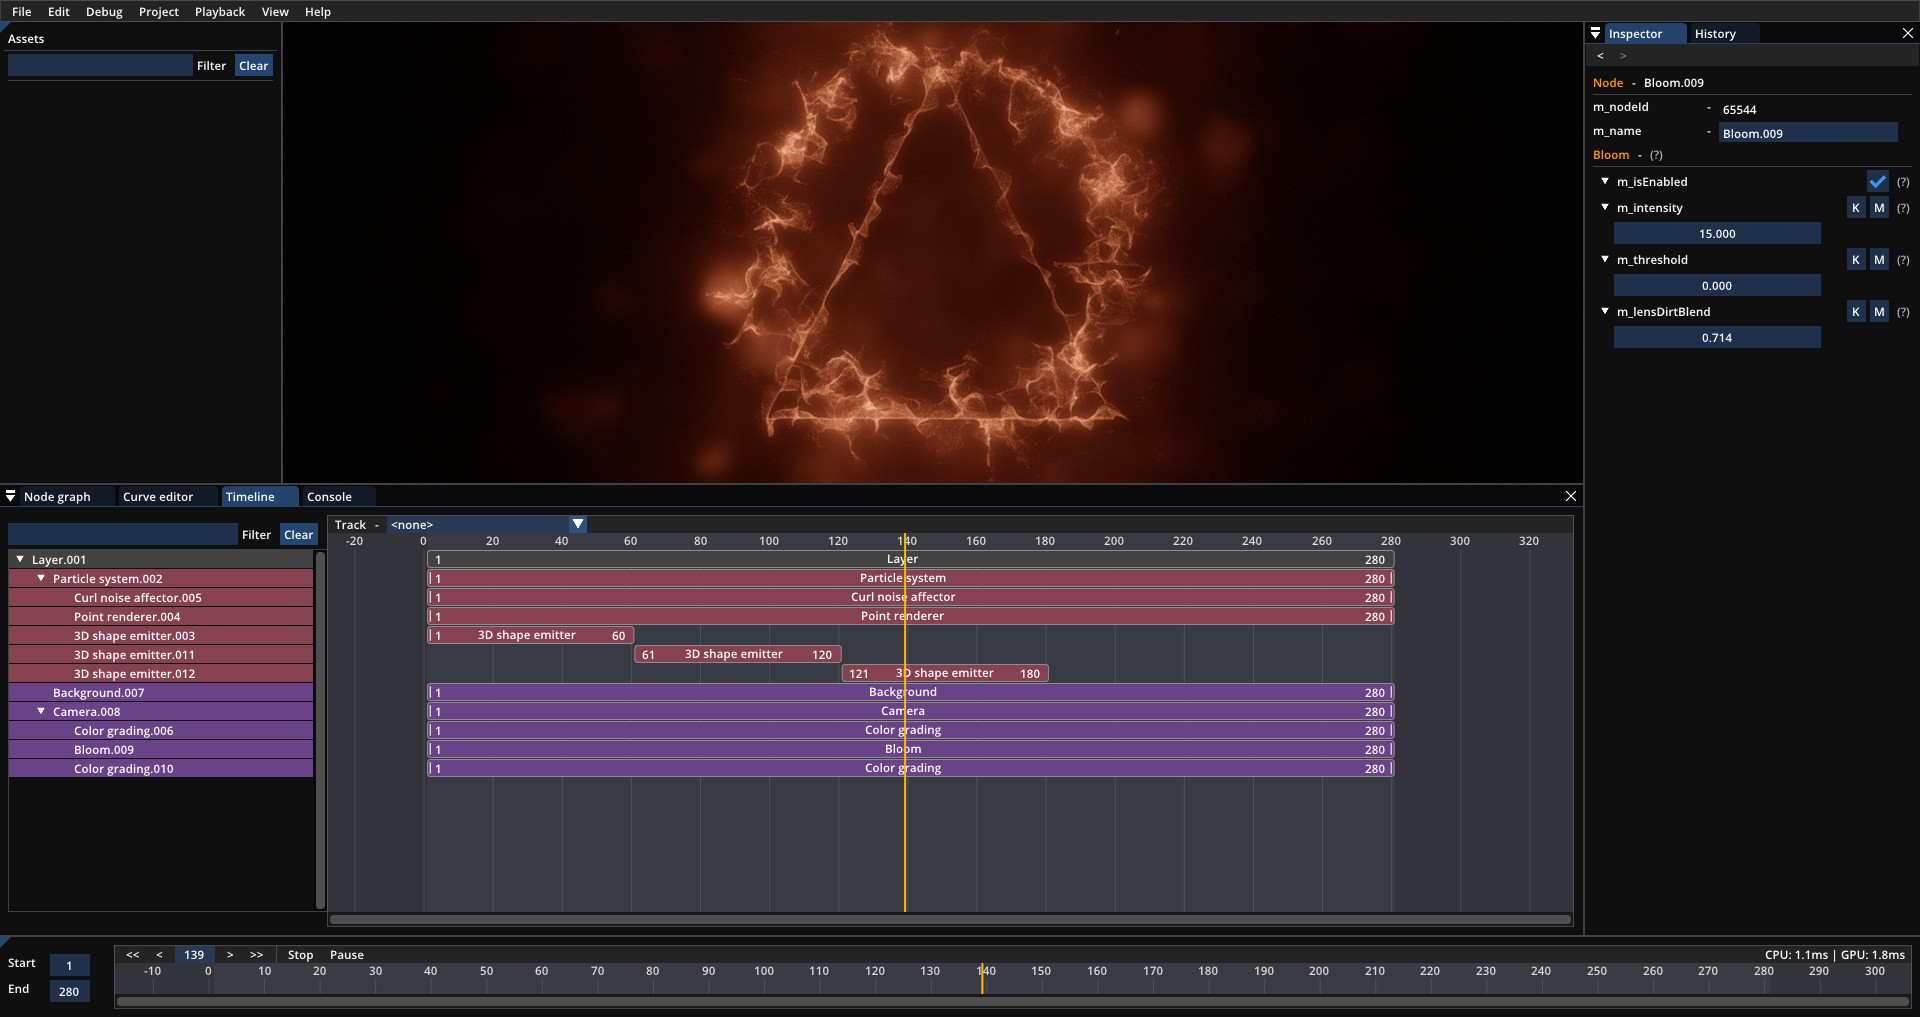
For this task, I pretty much mimicked Blender and added a “K” button next to all keyframe-able properties.
Once enabled, the property field would turn green, while modifying it would insert a new keyframe at the current frame index, turning the field orange to highlight the change.
I also found I had to disable the editing of keyframed properties during playback (something that’s otherwise possible and a great way to tweak the rendering of a scene) so as to avoid inserting what’d be one keyframe per frame. 🙂
Finally, I decided to have the timeline content be encoded for a 24Hz target frequency, meaning you could only ever store up to 24 keyframes inside a given second. This is fine however, as we can simply turn our frame index into a floating-point number and interpolate between keyframes if the demo ends up running at higher framerates.
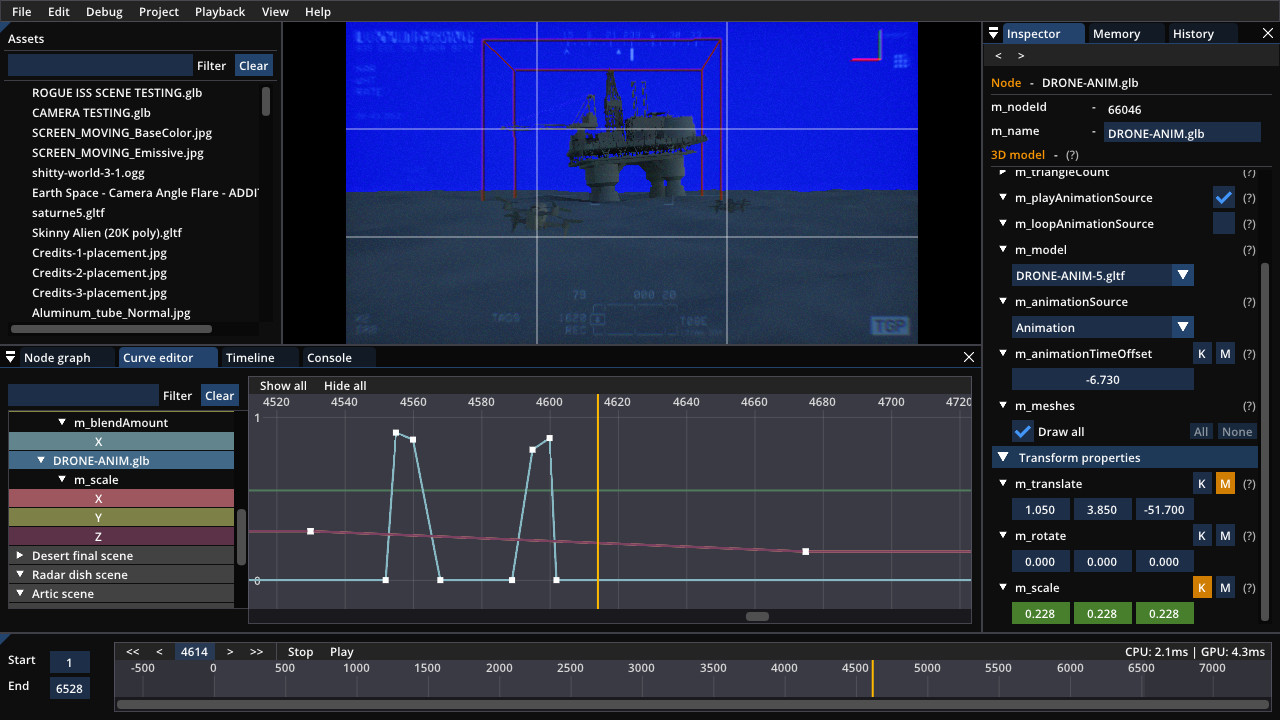
Points on a curve; still doing basic linear interpolation, cubic spline coming soon™.
One more thing I added was this “M” button, which you can see next to the keyframe toggle in the inspector panel.
Toggling it makes the property appear as a pin onto the node itself in the graph.
The user can then plug in other nodes and modify the property procedurally (adding the elapsed time in seconds, multiplying with a sine wave or noise function, etc.).
This is a great tool for continuous, repeating, or random animation. Things that would otherwise be a pain to do with editing a curve. As it turns out, we ended up using this functionality way more than the curve editor itself! This probably goes some way as to explaining why this view is the only part of the UI that hasn’t been completed yet…
Code nodes
I’ve mentioned throughout this post that I was mostly trying to steer away from visual programming, but we may still want to allow the use of coding for these moments where built-in nodes aren’t quite flexible enough. Instead of “coding with nodes” however, here you’d simply create a “code node” letting you write actual text inside a field (or copy/paste from Shadertoy!). You can then add “bindings” to create tweakable properties that can be accessed directly from the shader:
Code node with animated binding.
Oh, and these properties are just like any other node property, so they too can be animated and/or plugged into other nodes… 🙂
Conclusion
I hope this overview was useful, don’t hesitate to reach out or leave a comment!
comments powered by Disqus